It doesn’t take a genius to understand that math is boring to most people – including the people visiting your website. Furthermore, a stream of numbers directly blending in with your text-based content will be much difficult to understand and comprehend. However, for WordPress users, the problem can be easily solved by using a chart plugin to visually represent all the data and statistics.
Why Do You Need A Chart Plugin For Your WordPress Website?
A chart plugin for WordPress will interpret the data and statistics you provide and use it to create charts, graphs, and other visually accessible files for your readers. Not only will it make the information more readily digestible, but also add some extra flair to the overall UI of your Website.
Now, for the purpose of this read, we have put together a short list going over some of the popular chart plugins for WordPress and the features it brings to the table. These plugins should help you showcase data in a much more interactive and visual manner.
And so, without further ado, here are our picks of:
Top 8 free chart plugins for WordPress
1. Visualizer

Visualizer chart plugin for WordPress is a simple yet powerful tool to help you create, as well as manage, different interactive charts and tables on your WordPress websites. You even get support for Excel to WordPress integration which allows you to insert charts from your Excel directly to your WordPress site using a simple chart builder.
The plugin makes use of the Global Visualization API and DataTables.net to help create and add responsive as well as animated charts/diagrams to your website. Now, most of the features we just discussed are readily available with the free version of the plugin. But if you want access to more advanced functionalities, then a pro version exists as well.
Features:
- Support for 9 different chart types with 3 premium ones available in the pro version.
- Plenty of customization options to tweak the chart design and create coherence with your site’s aesthetics.
- Option to import data from other charts. (premium)
- Create charts using your WordPress posts, pages, products, and custom post types. (premium)
And much more.
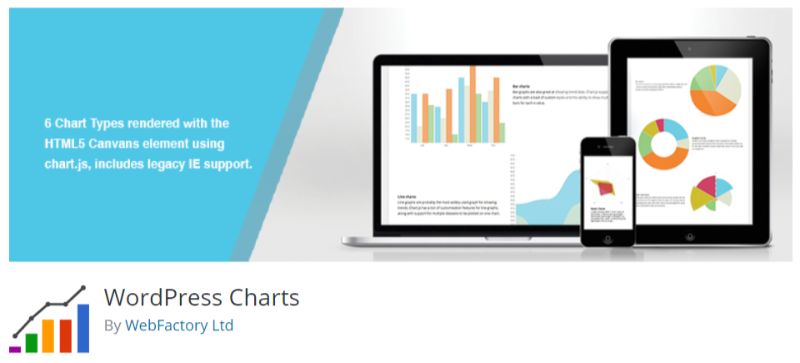
2. WordPress Charts
WordPress Charts uses the HTML5 Canvas element along with chart.js to help create different visual chart rendering of your data and statistics. It supports 6 different chart types, all of which can be further customized and even animation support to help the design match the overall aesthetics of your website.
However, despite being highly customizable and graphics intensive, the chart plugin is incredibly lightweight. You even get access to a WP Charts widget which makes it easier to showcase charts and data directly on the sidebar or any other widgetized area on your website.
Features:
- Helps create interactive charts using charts.js and the HTML5 Canvas element.
- Plenty of customization options including animation support.
- Access to 6 different chart types – Line Charts, Bar Charts, Pie Charts, Radar Charts, Polar area charts, and Doughnut Charts.
- WP Charts Widget included.
And much more.
3. M Chart

M Chart plugin for WordPress also makes use of the chart.js to help create visual charts from the provided data. Once installed, the plugin integrates a charts custom post type where you can create and add charts as you do with posts and pages. You can even add tags and categories to your charts as you can do with your posts and pages.
Now, as you choose to create a new chart, you will be presented with a spreadsheet interface to insert the data. There is even an option to upload a CSV file to import the data directly. Once done, hit “Publish” and the corresponding chart will be created. In order to embed the chart in one of your posts or pages, you will need to use the short code associated with the chart in question.
Features:
- Uses chart.js to help create interactive charts for your WordPress websites.
- Charts are created as custom post types.
- Support for 4 different types of charts – line, column, bar, and pie.
- Option to import CSV.
- Charts are embedded in your posts and pages using shortcodes.
And much more.
4. amCharts
amCharts is a map and chart plugin for WordPress which makes adding JavaScript content to your website as easy and effortless as possible. Once installed, the plugin will create a custom post type – Charts & Maps, where you can start creating new JavaScript content including visual charts using your custom data.
The plugin will analyze the data you have entered to create a visual rendering in the form of a chart or map. You can then embed this easily into your WordPress posts and pages using shortcodes. All graphics are easily customizable but require direct tweaks in the JS code.
Features:
- Makes it super simple to help you create JavaScript enabled maps and charts on your website.
- Support for different chart types including – Serial, Pie, XY, Funnel, Radar, Gauge, Stock, and Map.
- Create a custom post type for the Charts & Maps.
- Access the JavaScript code for the graphics to make customization tweaks directly inside the code.
- Embed the graphics using shortcodes.
And much more.
5. Stockdio Historical Chart

Stockdio Historical Chart plugin is perfect for WordPress websites in the financial niche, dealing with stock prices and related data. You will get access to a dedicated plugin along with a widget to help you embed live charts displaying intraday as well as historical prices of stocks, indices, currencies, and even commodities.
The plugin has support for over 65 different stock exchanges alongside a large number of market indices, currencies, and commodities. All the data can be displayed in either one of the 5 different formats – Line, Candlestick, Area, OHLC, and HLC. Besides this, some of the other notable features of the plugin include the option to compare different stocks, display the volume of each chart, track performance instead of price, and much more.
Features:
- Helps you display intraday as well as historical data on stocks and market indices with the help of graphics charts.
- Support for over 65 different stock exchanges.
- Option to display the stock data in different formats – Line, Candlestick, Area, OHLC, and HLC.
- Widget supported.
And much more.
6. Easy Charts
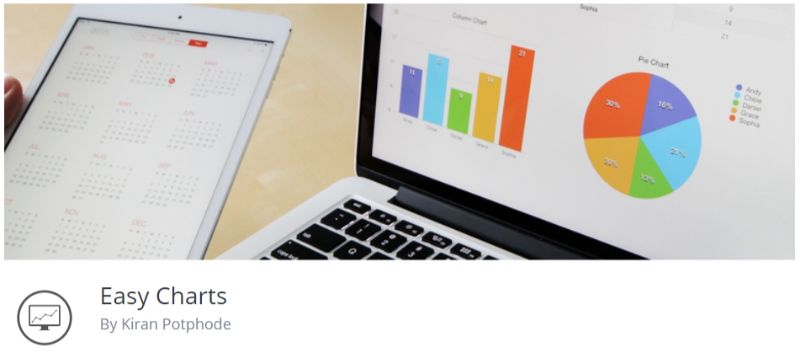
Easy Charts WordPress plugin offers a simple means to create rich charts for your pages and posts. The plugin is developed using the uvCharts JavaScript Library and creates interactive charts using SVG and CSS3 transition effects. So not only is it helping you visualize your data, but also enhances the overall UI and UX of your website.
Now the plugin brings support for 12 different chart types, all of which can be easily tweaked and customized using dedicated configuration options. You will also have the option to import the data in a CSV file and let the plugin do its magic.
Note: The plugin hasn’t been updated for the last 3 major releases of WordPress. It might show certain compatibility issues with the current version of the CMS.
Features:
- Create rich charts using SVG and CSS3 transition effects.
- Support for 12 different chart types included.
- All charts created using the plugin are responsive and mobile friendly.
- Lots of customization options including redefined designs and color preferences.
- Option to download charts as image files.
- Support for CSV imports.
- Quick Insert functionality allows you to embed the charts anywhere on your site.
And much more.
7. YITH Product Size Charts for WooCommerce
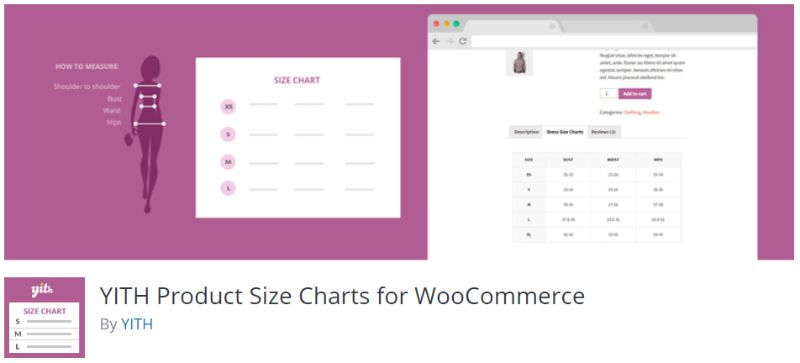
As is evident from the name itself, here we have a chart plugin that gives you the option to create custom size charts for the products in your store. This is perfect if you are running a WooCommerce store selling shoes and dresses that come in different sizes. You can even use it for online furniture stores or anything else that comes to mind which involves a careful understanding of the measurements and sizes of the products.
Once installed, the plugin helps you to add a reference guide in the form of a chart so users can understand what the sizes mean in centimeters or inches, and how to make measurements. A simple feature that can increase customer satisfaction and reduce the overall complaints you got for products getting delivered that weren’t the right size.
Features:
- Helps you create size charts for the different products on your WooCommerce enabled WordPress e-store.
- Size Charts are created as custom post types.
- Option to create almost unlimited size charts for different products like shoes, shirts, furniture, and so on.
- Size Charts can be assigned to products or configured to display in a custom tab for each product page.
And much more.
8. Infogram
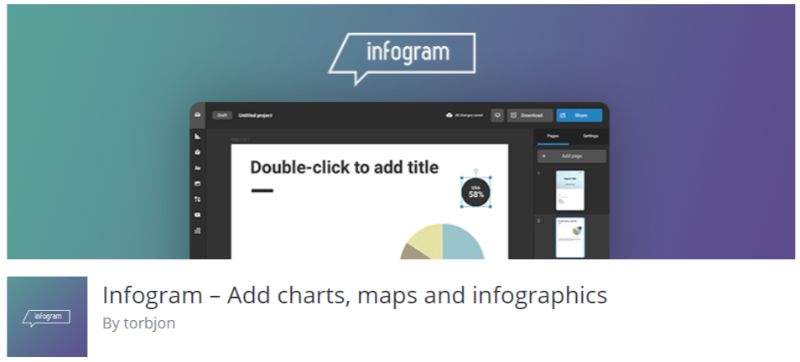
And now for the final chart plugin on our list, we have Infogram – a data visualization tools which will help you create charts as well as maps and infographics for your WordPress website. The plugin gives access to high-quality template designs with visually-balanced color presets to streamline your creation process.
Now, to use the plugin, you need to create an account with Infogram. Furthermore, you will also have to create charts and infographics from their website. Once done, the graphics will be saved in your personal library. The plugin will allow you to insert the content on your Infogram library, directly from your WordPress Editor.
Note: The plugin hasn’t been updated for the last 3 major releases of WordPress. It might show certain compatibility issues with the current version of the CMS.
Features:
- Connects your WordPress editor with your Infogram account to import the different charts and infographics you have created using the platform.
And much more.
In Conclusion
So these were our picks for the top 8 chart plugins for WordPress. Do let us know if you found the read helpful, and don’t forget to mention which plugin you liked best for your personal project. Furthermore, users with experience with other chart plugins which they wish were mentioned on the list, can leave their recommendations down in the comment section.
Likewise, experienced users are also welcome to lend their insight on the importance of using charts and visually accessible data on their websites. Your fellow readers will definitely benefit from your stories, and it might even help them out with their own projects.
Now you are all set to integrate charts and graphs into your WordPress site.
