Websites are about conveying a message and information to an audience. When you integrate charts and graphs into WordPress, you are able to do exactly that in a visual and appealing way.
And we know how visuals improve appeal and engagement with a website.
If you are in an especially data rich niche, charts and graphs help you to visualize rather boring data in a way that lay individuals can grasp.
For this article, we shall use, Visualizer: Tables and Charts Manager for WordPress (Lite) to Integrate Charts and Graphs into a WordPress.
The lite version is a free WordPress plugin that provides you all the essential features for creating charts and graphs.
Step by Step: How to Integrate Charts And Graphs into A WordPress Site?
Step 1. Install Visualizer to Integrate Charts and Graphs into a WordPress
We shall start off by installing the plugin to our WordPress website.
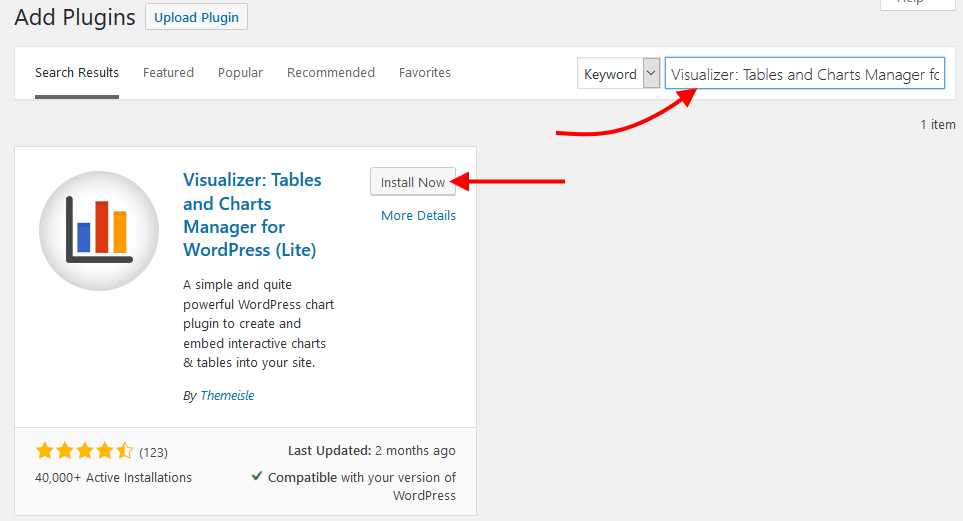
If you prefer an easier way, then login to your site’s admin area, then navigate to Plugins, Add New.
Then search for Visualizer: Tables and Charts Manager for WordPress.
Click Install now, and then activate the plugin.
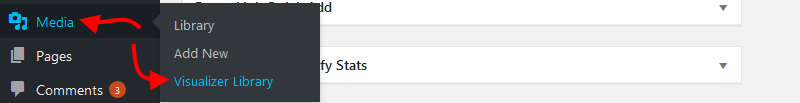
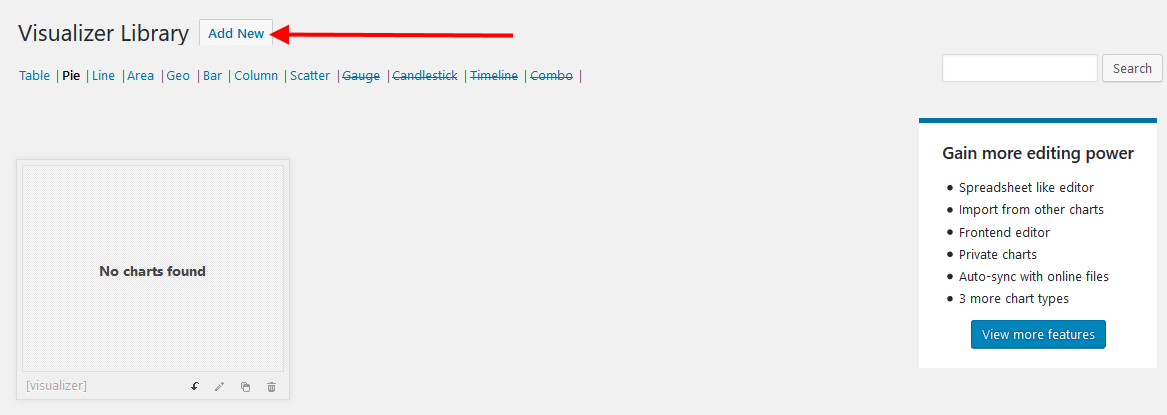
Once it is installed and activated, you can find Visualizer under Media, then Visualizer library.
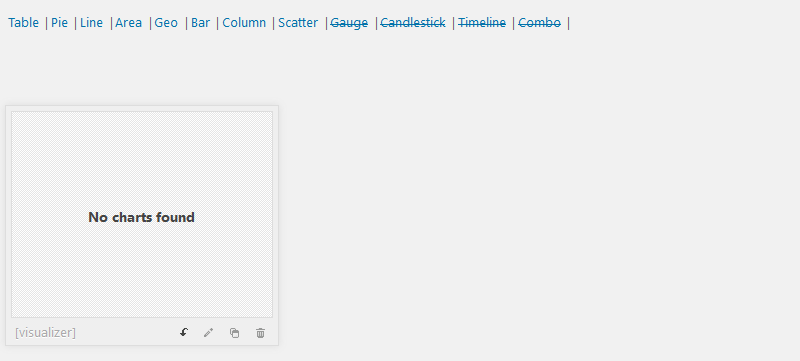
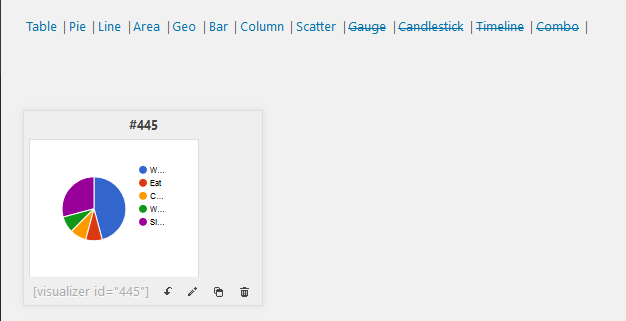
With the lite version of Visualizer, you can add the following types of charts and graphs.
Tables, Pie charts, line charts, Area graphs, Bar graphs, columns and scatter charts.
The Premium version has for more charts you can add, Gauge, Candlestick, Timeline, and combo chart.
Step 2: Add new charts
To add a chart, In the Visualizer library, on top, where the title is, click Add New.
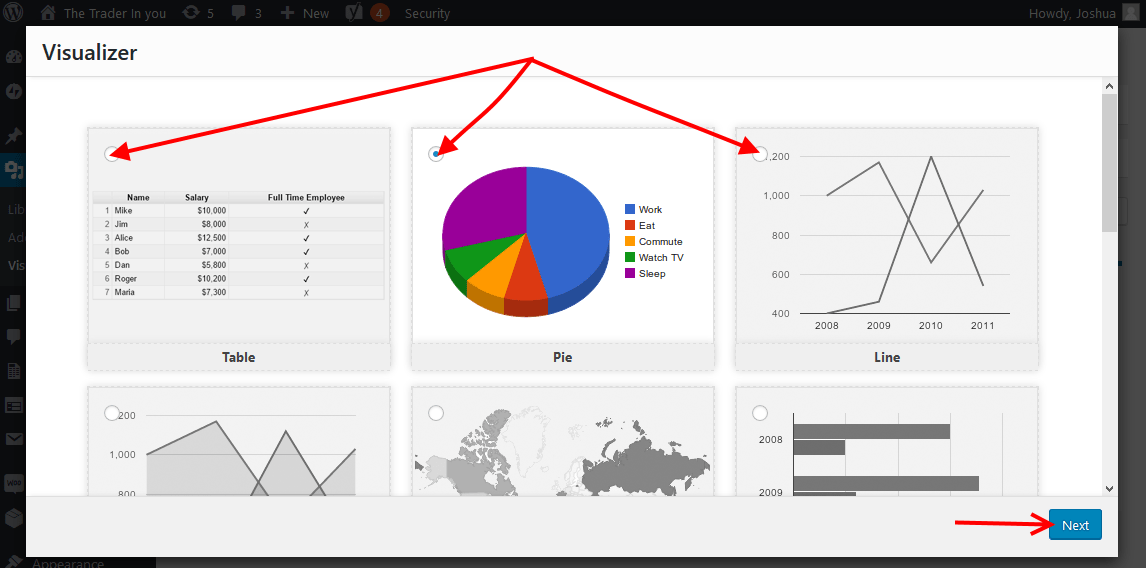
Select the chart or graph you want to use and then click Next.
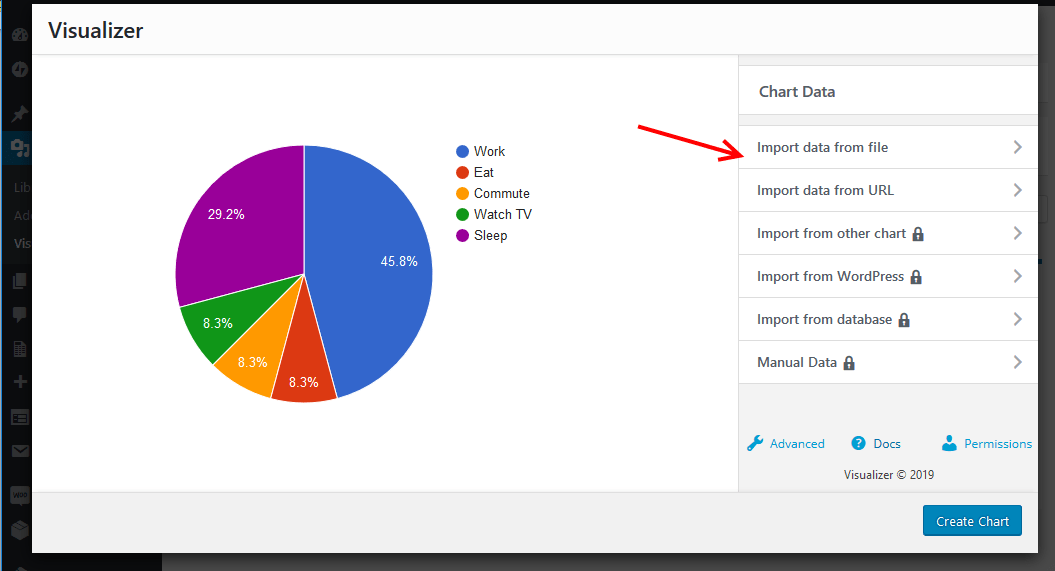
On the right, click Import data from file or import data from URL. Those are the only two options of entering data using the free version.
Click the Browse button to add the file to be imported, then click Import.
The chart is reloaded on the screen with your data captured.
Click Create Chart after that.
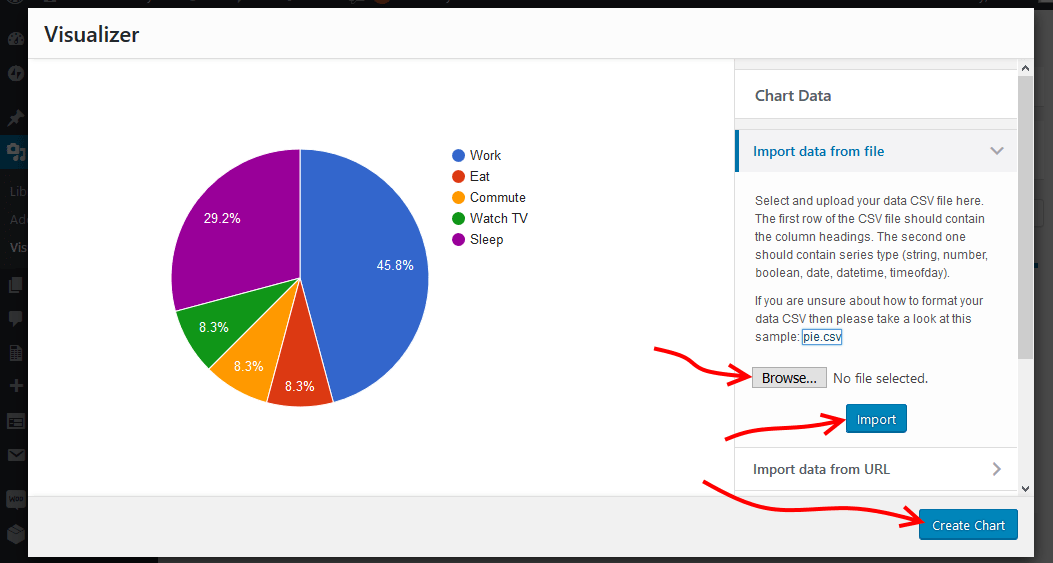
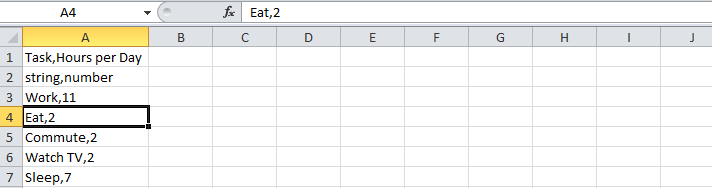
If you do not know how to create or format the CSV, you can download the sample CSV just above the Browse button of the chart you are creating.
For instance, this is the format for a Pie chart.
You are taken now to the plugin chart dashboard, where you should see your newly created chart.
Step 3. Integrate Charts and Graphs into a WordPress
Once you have created your charts or graphs, go to the post or page you want to integrate charts and graphs into.
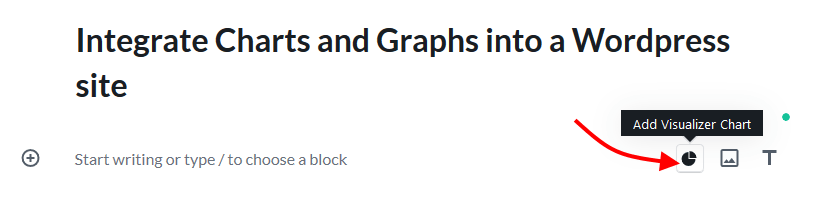
When you click or hover over a block, on the right, you should see the Visualizer block icon next to the image and text block icons.
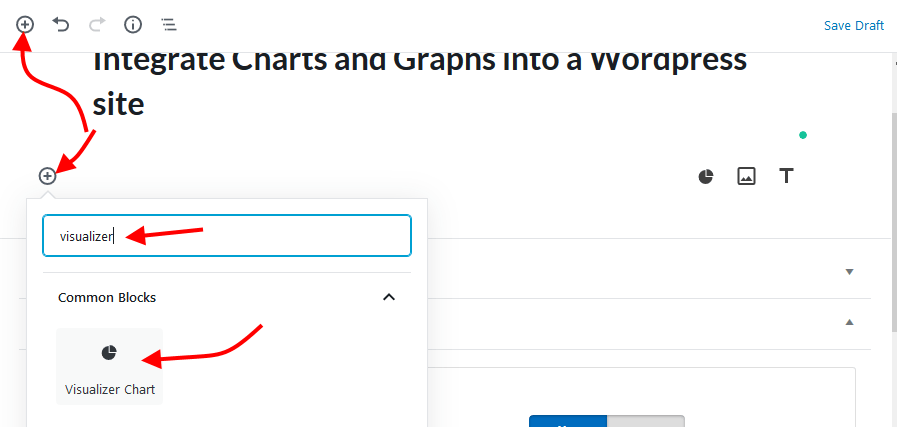
Alternatively, click any Add Block + Icon, if Visualizer chart is not there in the most used blocks, then search for it – enter visualizer, then click Visualizer chart.
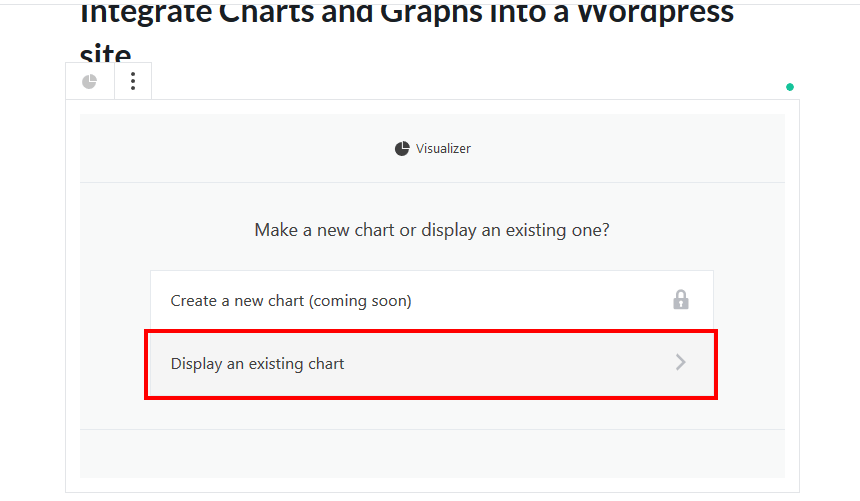
Next, click Display an existing chart.
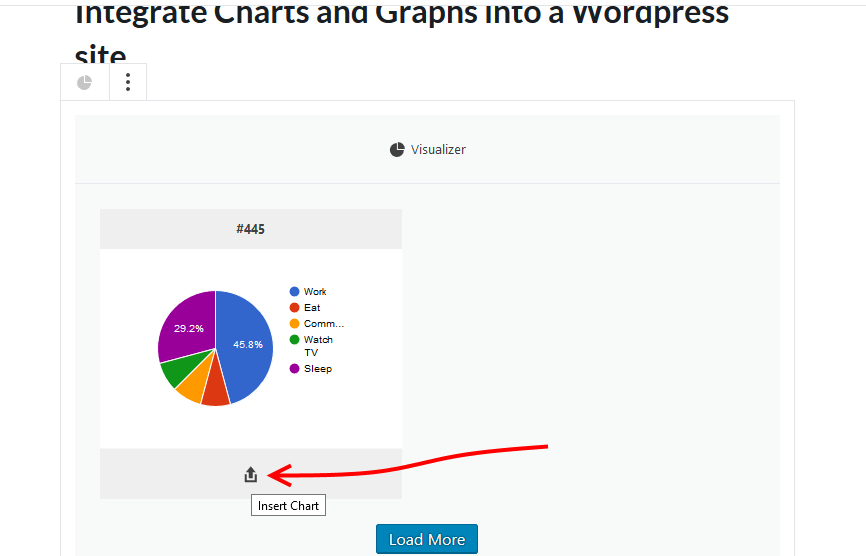
All the charts will be populated, from there click the Insert Chart button to add the chart to your page or post.
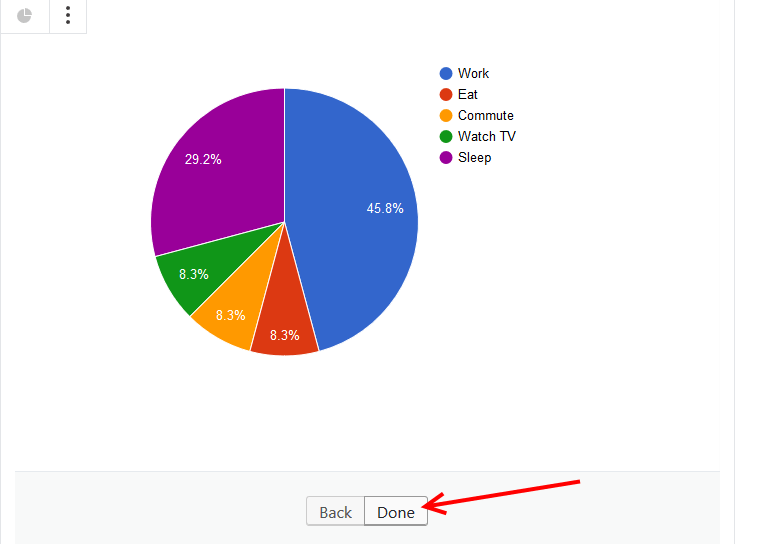
Back in your editor, click Done.
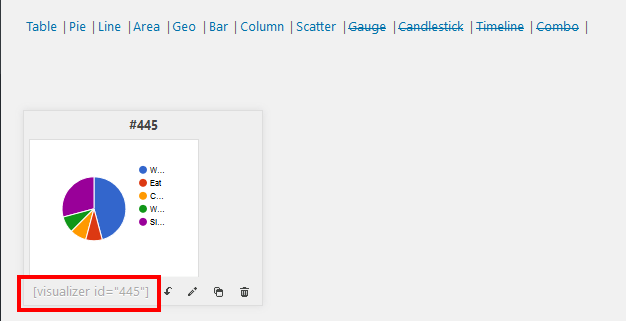
If you do not want all the hustle, you can also add your chart or graph to a post or page by copying and pasting the shortcode there.
You can copy the chart or graph’s shortcode from Media > Visualizer Library.
Click the shortcode of the chart you want to select it.
Go to your post or page, and paste it there.
When all is done, publish your page.
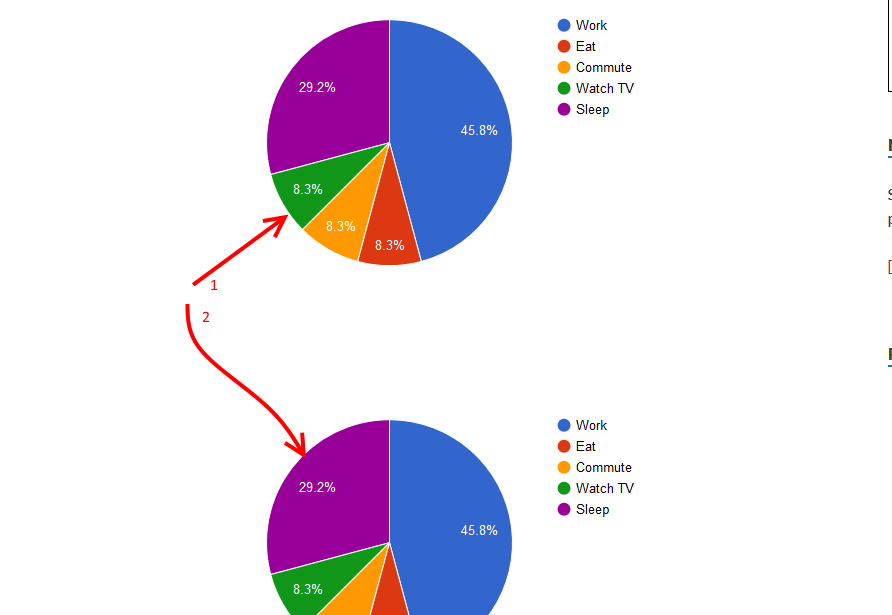
Viewing the page or post, chart 1 we used the block editor and chart 2 we used the shortcode.
Conclusion
Visualizer: Tables and Charts Manager for WordPress (Lite) allows you to Integrate Charts and Graphs into a WordPress easily.
The premium version provides you with a ton of more cool features to simplify and build more powerful charts and graphs, but, the free version is good enough for a start.
We have shown you exactly how to do that in this article, and now it is your turn to go and add color and flair to your content by integrating Charts and Graphs into your WordPress website.
Your website visitors will definitely love consuming your content.
Just in case you want alternatives, you may also want to try out any of these other plugins to integrate charts and graphs into a WordPress website.
- WordPress Charts
- amCharts:Charts and Maps
- Infogram– Add charts, maps, and infographics
For more options and details, please check out our top picks for the best free chart and graph plugins for WordPress to visually showcase data